• Skip to primary navigation
  • Skip to main content
  • Skip to footer

Reflective Democracy Campaign

Investigates and disrupts the demographics of power in the United States

MenuMenu
  • About Us
  • Our Work
        • Overview
        • Organizing
        • Research
        • Datasets
        • Our Work in Focus
        • The Criminal Justice System Exposed
        • The Rise of Women of Color
        • A New Path for Political Gatekeepers
  • News & Insights
  • Contact Us

Home / Research / Data Analysis

Who Ran On November 3rd? US Senate, House, and State Legislature Candidates by Race and Gender

Updated: November, 2020
Released: October, 2020

  • View the Memo
A map of the US overlayed by voting stickers and a mail in ballot envelope

In advance of the November 3, 2020 election, we discovered a remarkable shift in the race and gender demographics of general election candidates from 2012 to 2020.

  • Across the electoral landscape, political power is shifting away from white men, and towards women and people of color.
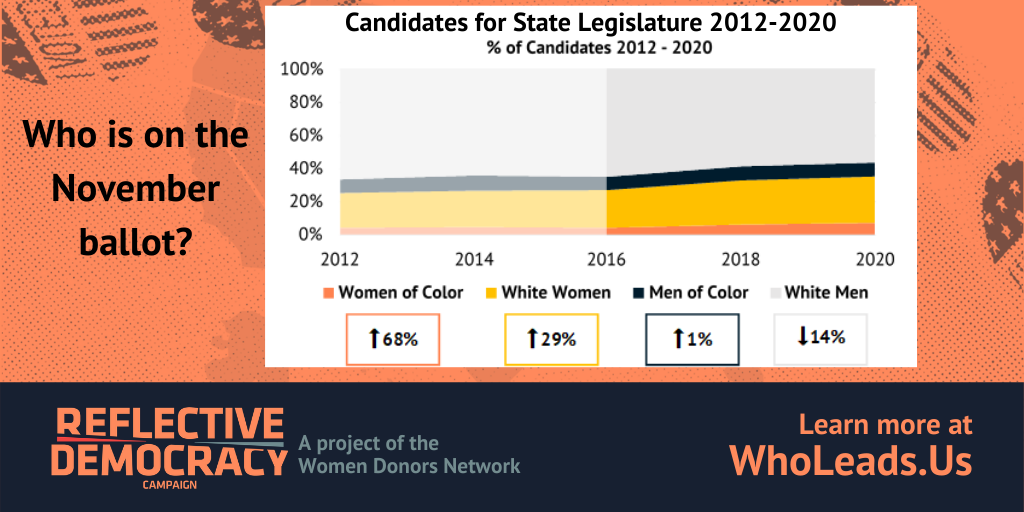
  • At a pace that dramatically accelerated after 2016, women and people of color are surmounting structural barriers to win primary elections for Congress and state legislature across the country.

Contrary to conventional wisdom about white men’s superior “electability,” women and people of color win elections at the same rate as their white male counterparts. In fact, across all levels of government, white men are the only demographic whose political power is on the wane. Voters are rejecting the old boys’ club model of politics, and the November 3rd election broke new records in victories by leaders who reflect all Americans.

  • View the Memo

About the Data

Reviewing voter files and other publicly accessible data, we tracked over 1,100 Congressional candidates and over 10,000 state legislature candidates on the November 3, 2020 ballot.

  • Who Ran on Nov 3rd? Congressional and State Legislature Electoral Landscape 2020 (zip, 1.94 MB)
    Download Dataset

Read more on...

Demographic Power Shifts Elections & Outcomes

Share our Findings

Graphic
Chart showing an increase of women of color in state legislatures
Candidates for State Legislature 2012 - 2020

Candidates for State Legislature 2012 - 2020

Chart showing an increase of women of color in state legislatures

Right click and save the image or click here to download it.

Footer

Reflective Democracy Campaign

Find us on

  • Twitter
  • Facebook
  • RSS Feed

Research

  • Data Analysis
  • Datasets

Organizing

  • Grantmaking
  • Structural Change

Women Donors Network logo

The Reflective Democracy Campaign is a Project of the Women Donors Network.

Site by Rocketkoi