A decade of shifts to the demographics of political power drove a backlash leading to the outcome of the 2024 election.
Our first longitudinal study examining a full decade of data on race, gender, and elections finds that even as white men remain vastly over-represented in elected office, women and people of color are making meaningful inroads towards a multi-racial, gender-balanced government.
Rethinking “Electability”
When we ran the numbers ten years ago, white men held 65 percent of state and federal seats. Women were a dismal 19 percent of Congress and one quarter of state legislators. Since then, both women and people of color have made remarkable gains. In fact, the only demographic that’s lost seats in the last ten years is white men, with decreases at every level: federal, state cabinet, and state legislature.
Demographic Changes in Elected Officials: 2014 vs 2024
| Federal | State Cabinet | State Legislature | All | |||||||||
|---|---|---|---|---|---|---|---|---|---|---|---|---|
| 2014 | 2024 | 2014 | 2024 | 2014 | 2024 | 2014 | 2024 | |||||
| Women of Color | 6% | 12% | 3% | 7% | 5% | 10% | 5% | 10% | ||||
| White Women | 13% | 17% | 20% | 25% | 20% | 10% | 20% | 23% | ||||
| Men of Color | 11% | 15% | 5% | 11% | 10% | 11% | 10% | 11% | ||||
| White Men | 71% | 57% | 72% | 57% | 65% | 56% | 65% | 56% | Total | 100% | 100% | 100% | 100% | 100% | 100% | 100% | 100% |
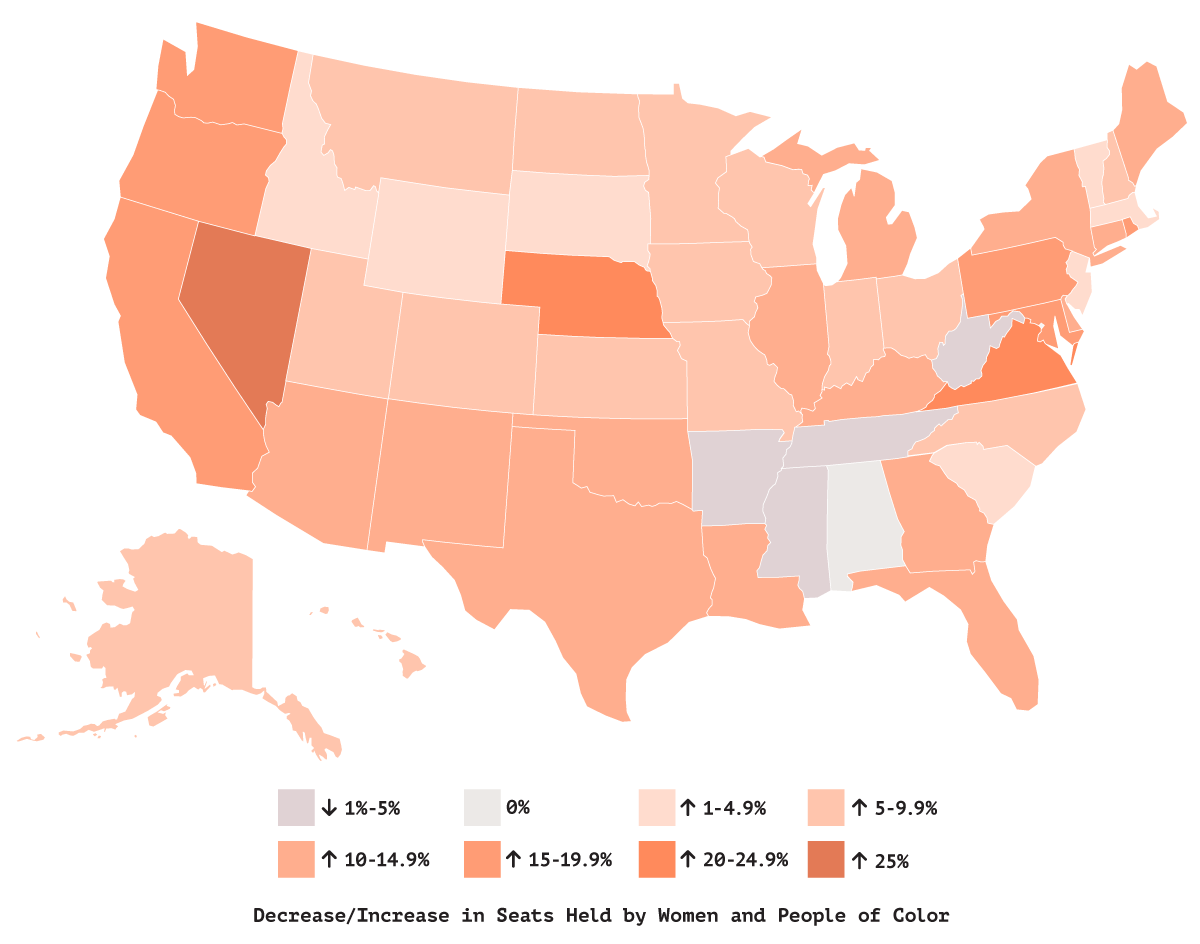
States of Change
Across all regions of the country, the demographics of state legislatures have shifted dramatically in the past ten years. Today, state legislators in 46 states are more reflective of their constituents than ten years ago, with women and/or people of color gaining the highest percentage of seats in Nevada, Nebraska, Virginia, and Maryland.
Even as the 2016 election appeared to signal the ascendancy of the traditional white male politician, a funny thing happened during the midterms: In 2018, voters elected more women and people of color into state legislatures than at any other time in American history.
A Decade of Reflective Growth in State Legislatures
In all but five states, seats held by women and people of color increased between 2014 and 2024