• Skip to primary navigation
  • Skip to main content
  • Skip to footer

Reflective Democracy Campaign

Investigates and disrupts the demographics of power in the United States

MenuMenu
  • About Us
  • Our Work
        • Overview
        • Organizing
        • Research
        • Datasets
        • Our Work in Focus
        • The Criminal Justice System Exposed
        • The Rise of Women of Color
        • A New Path for Political Gatekeepers
        • Democracy Facts
        • The US, made up of orange, white, and light blue dots. Some dots are larger than others.

          Facts speak louder than memes and misinformation. Explore our Democracy Facts.

  • News & Insights
  • Contact Us

Home / Research / Data Analysis

The Electability Myth: The Shifting Demographics of Political Power in America

August, 2019

  • View the Report
Chart showing women candidates have increased across all levels of government

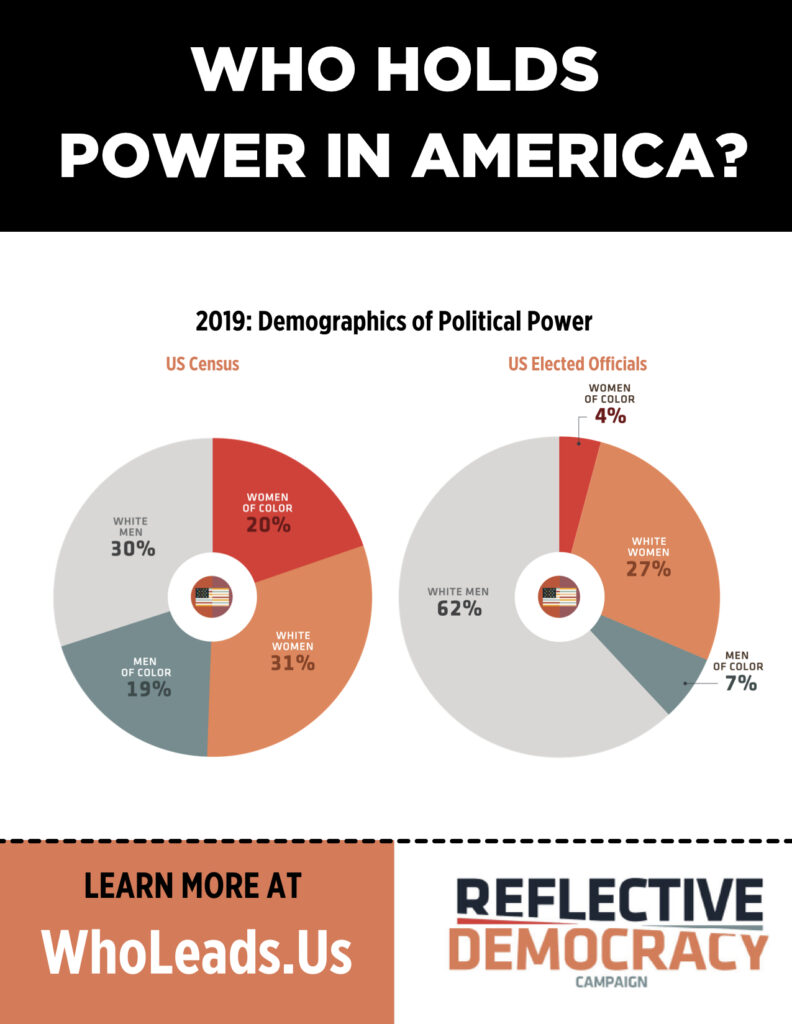
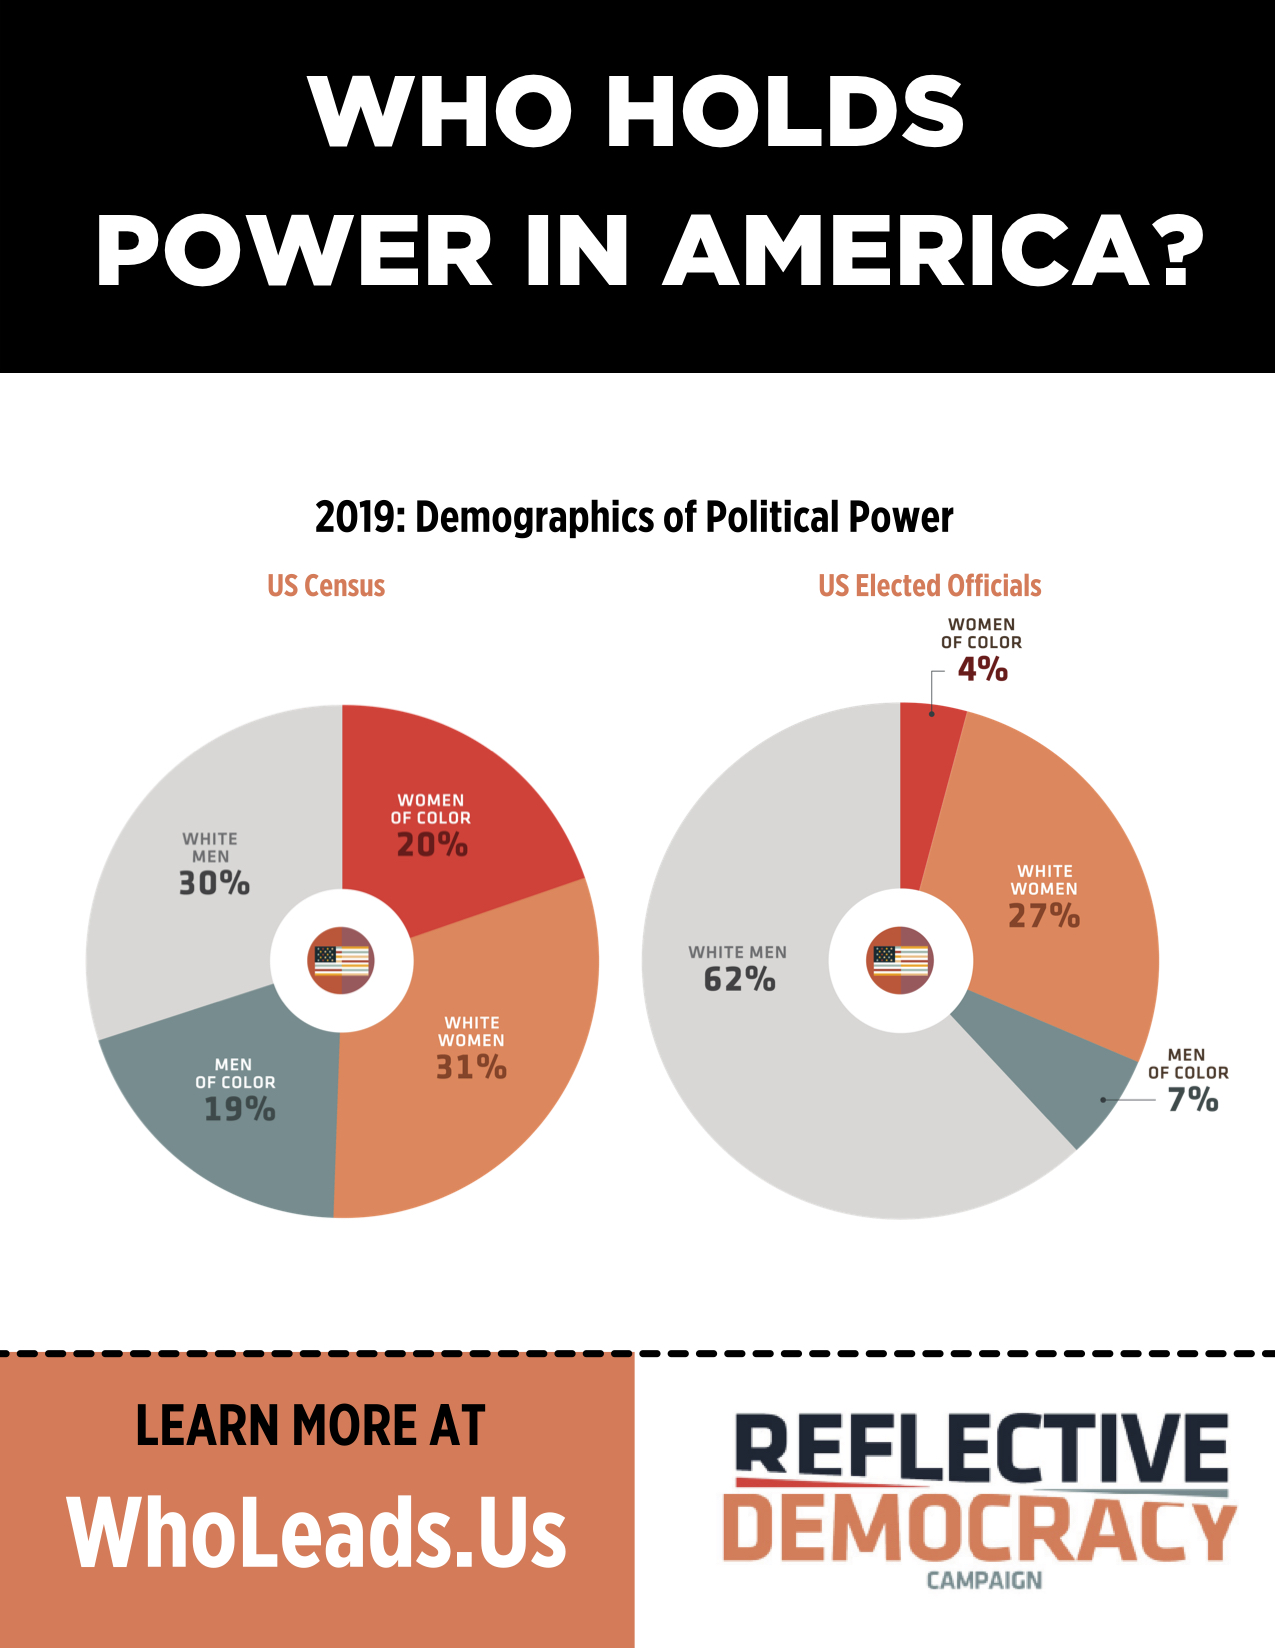
In the run-up to the 2020 election, debates about “electability” occurred against an historic yet overlooked upheaval in American politics. Women and people of color were winning more elections to federal, statewide, and state legislative offices – while white men’s share of seats declined.

Chart showing women candidates have increased across all levels of government

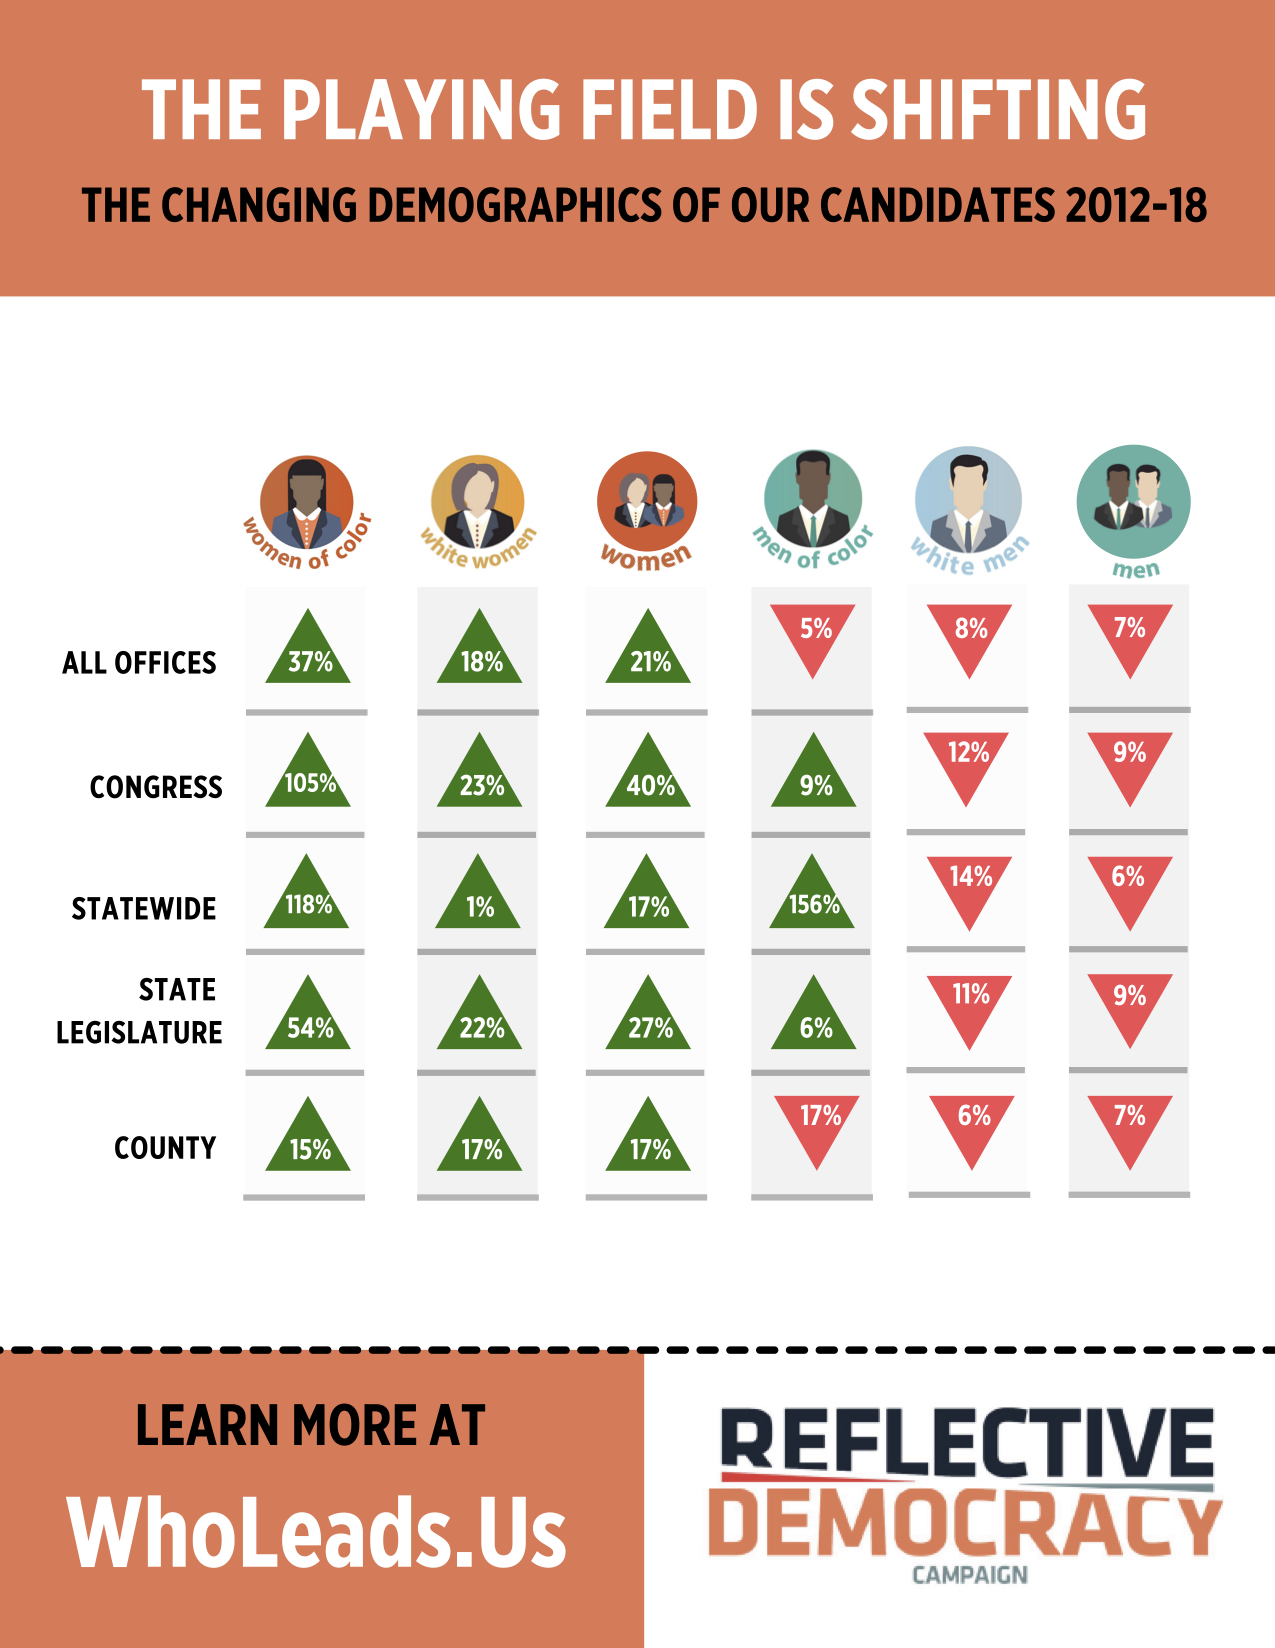
In 2019, we found white men massively over-represented in politics: At 30% of the population, they held 62% of offices. But since 2012, women and people of color had been chipping away at white male overrepresentation, winning a record-breaking share of political power at the federal, state, and local levels.

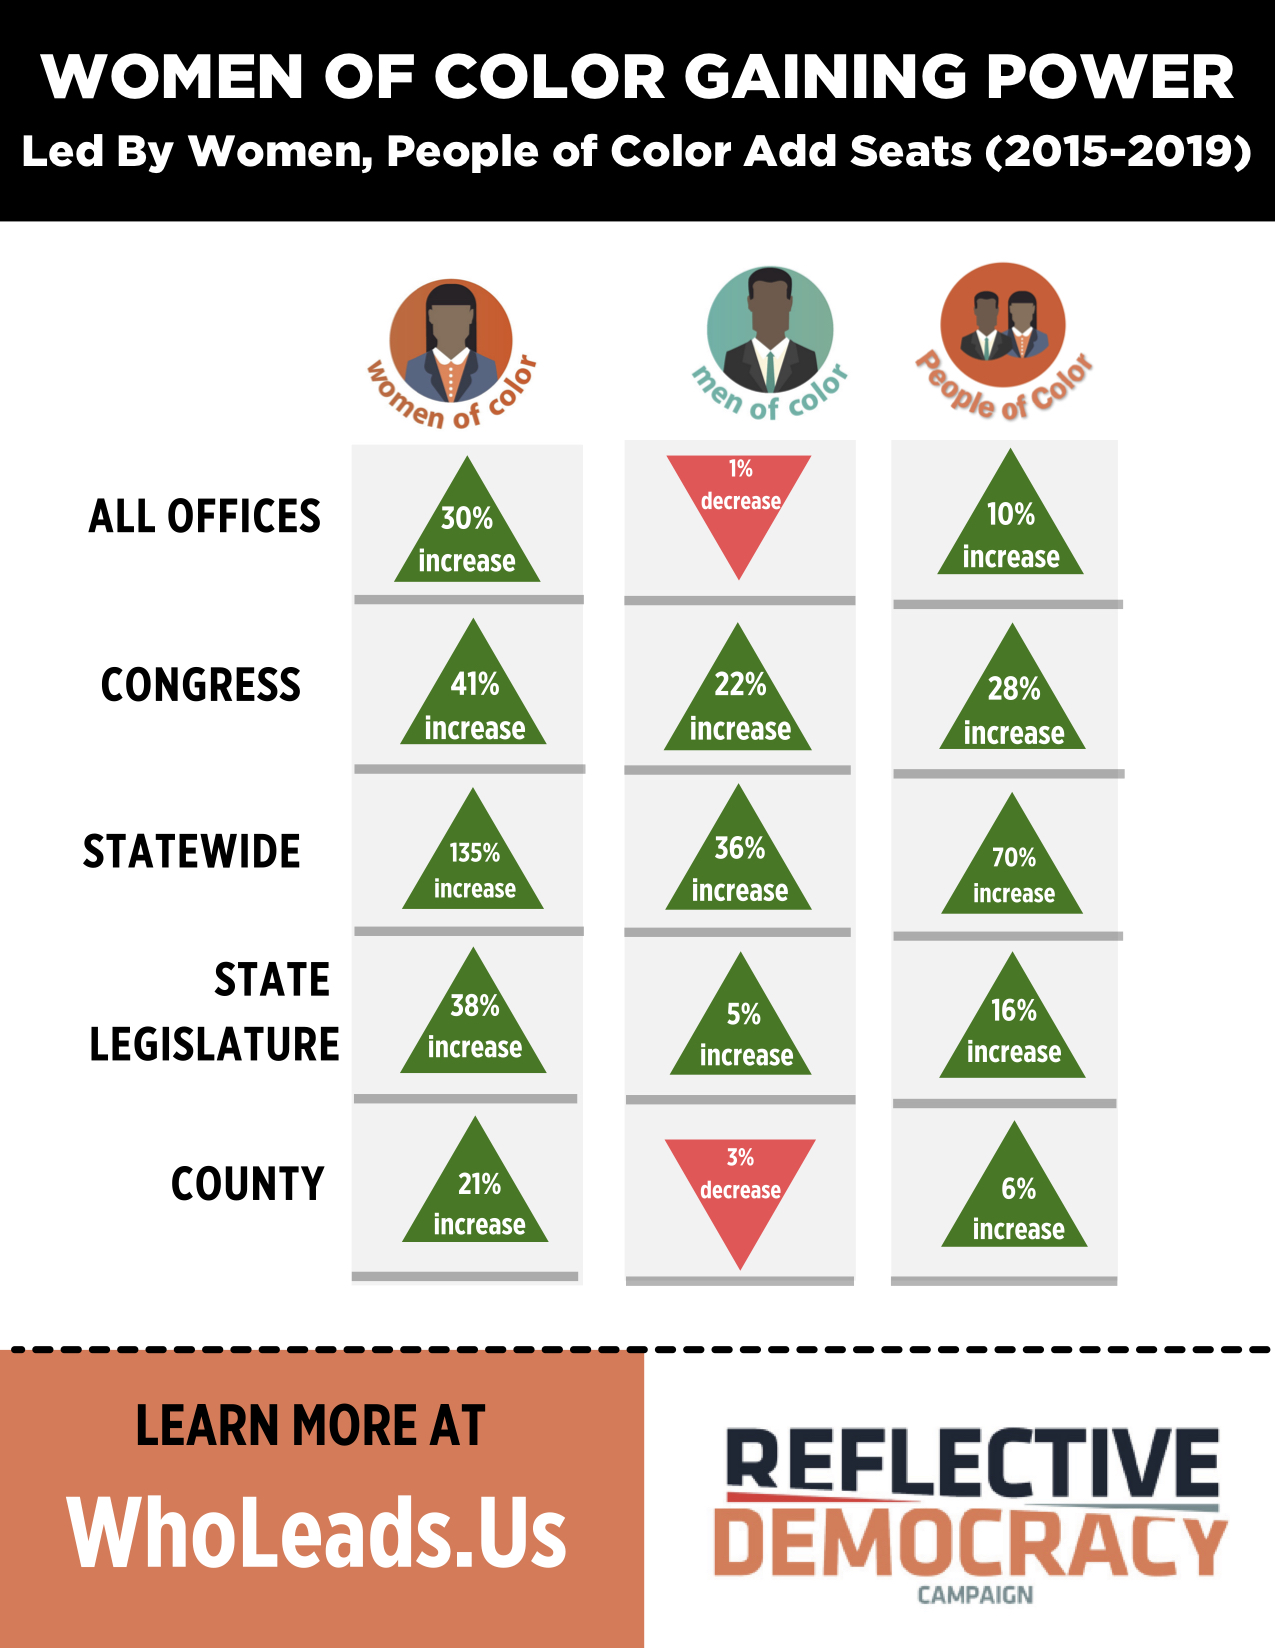
  • Women of color – the most under-represented demographic – were on the rise, making major gains in elections at every level of office.
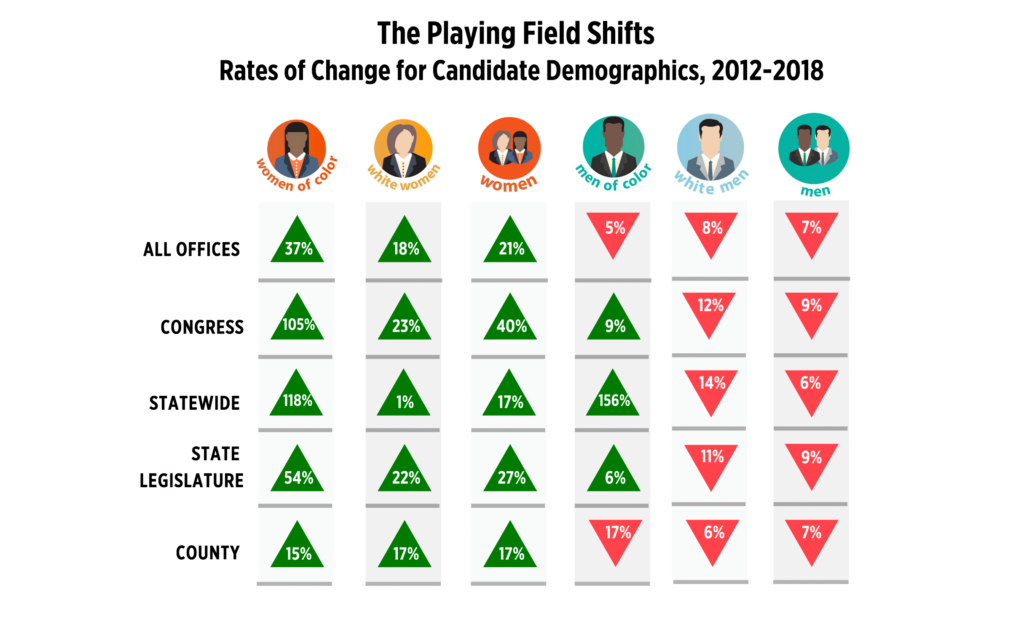
  • Women – both white and of color – increased their share of seats in Congress by 40%.
  • Men of color won more seats in Congress, statewide office, and state legislatures.
  • The only demographic whose political power ebbed at every level of office were white men.

In the Media

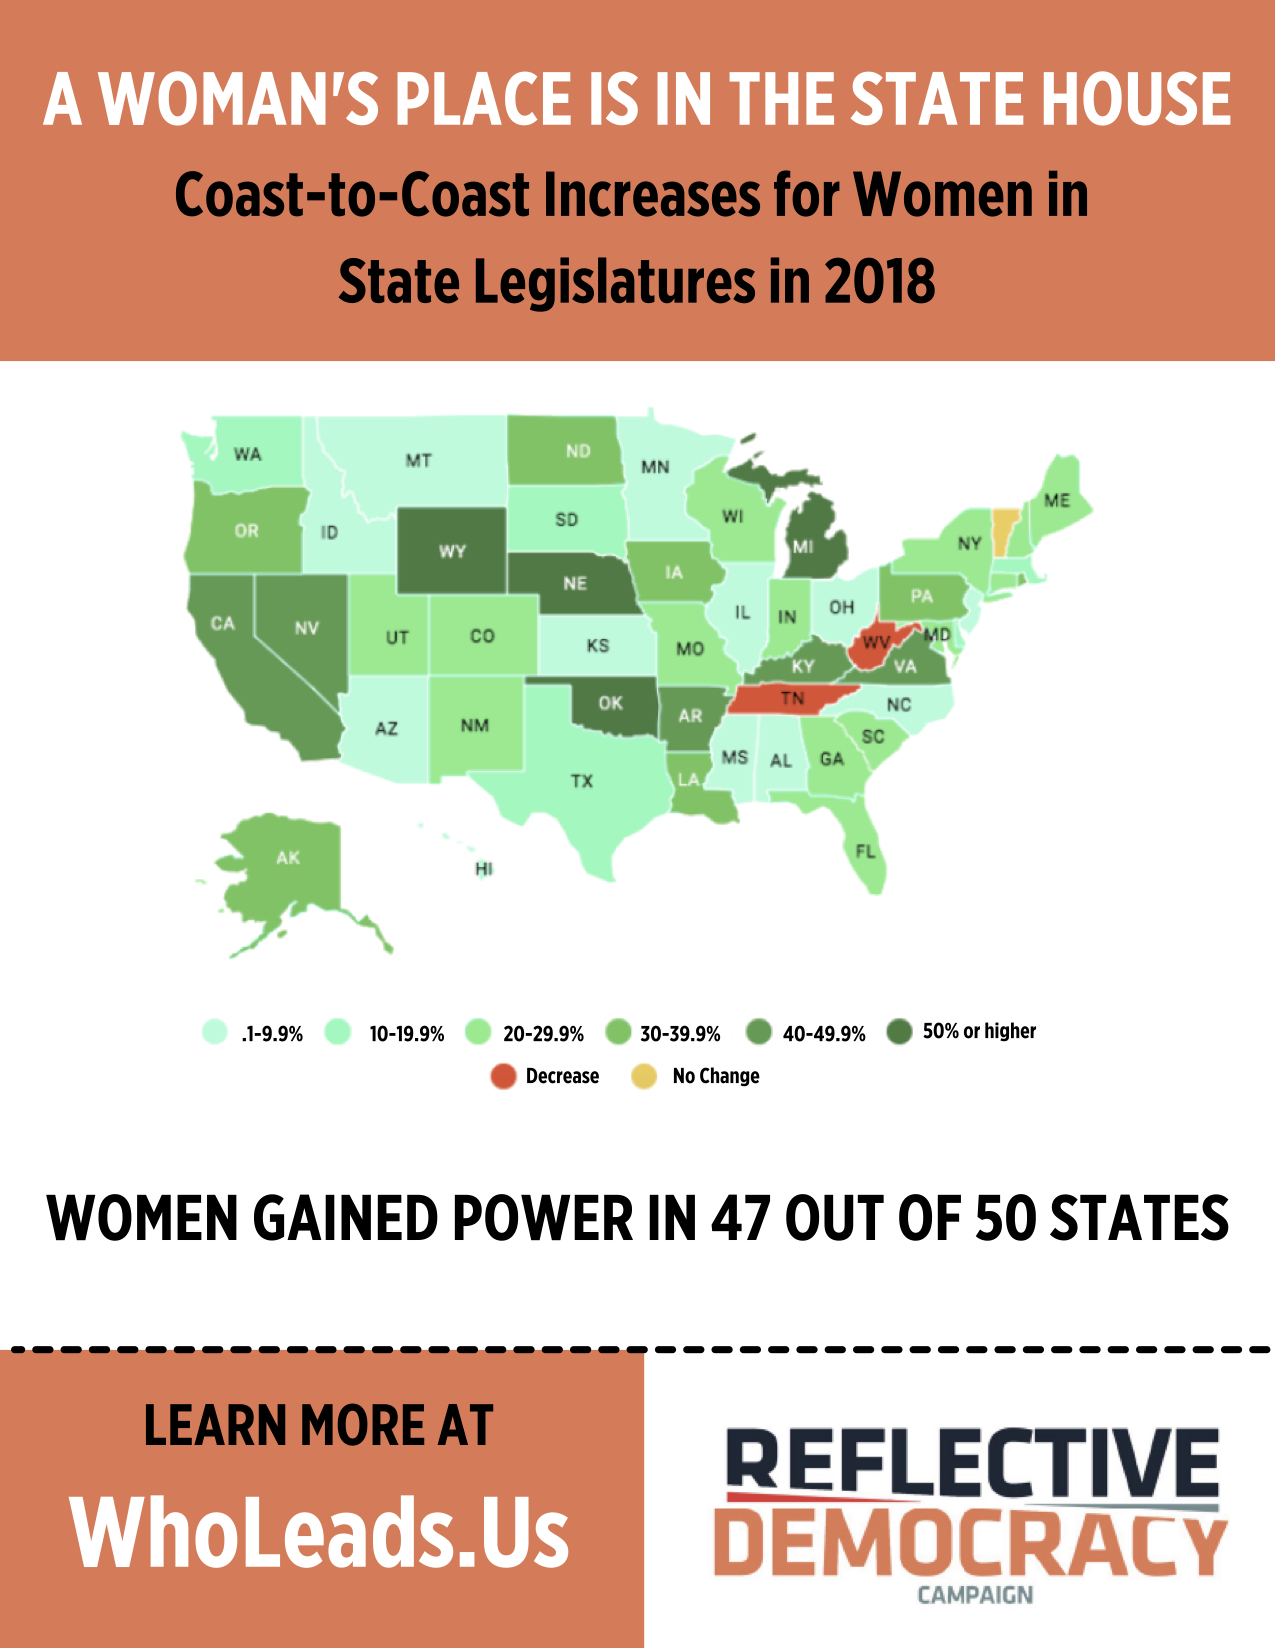
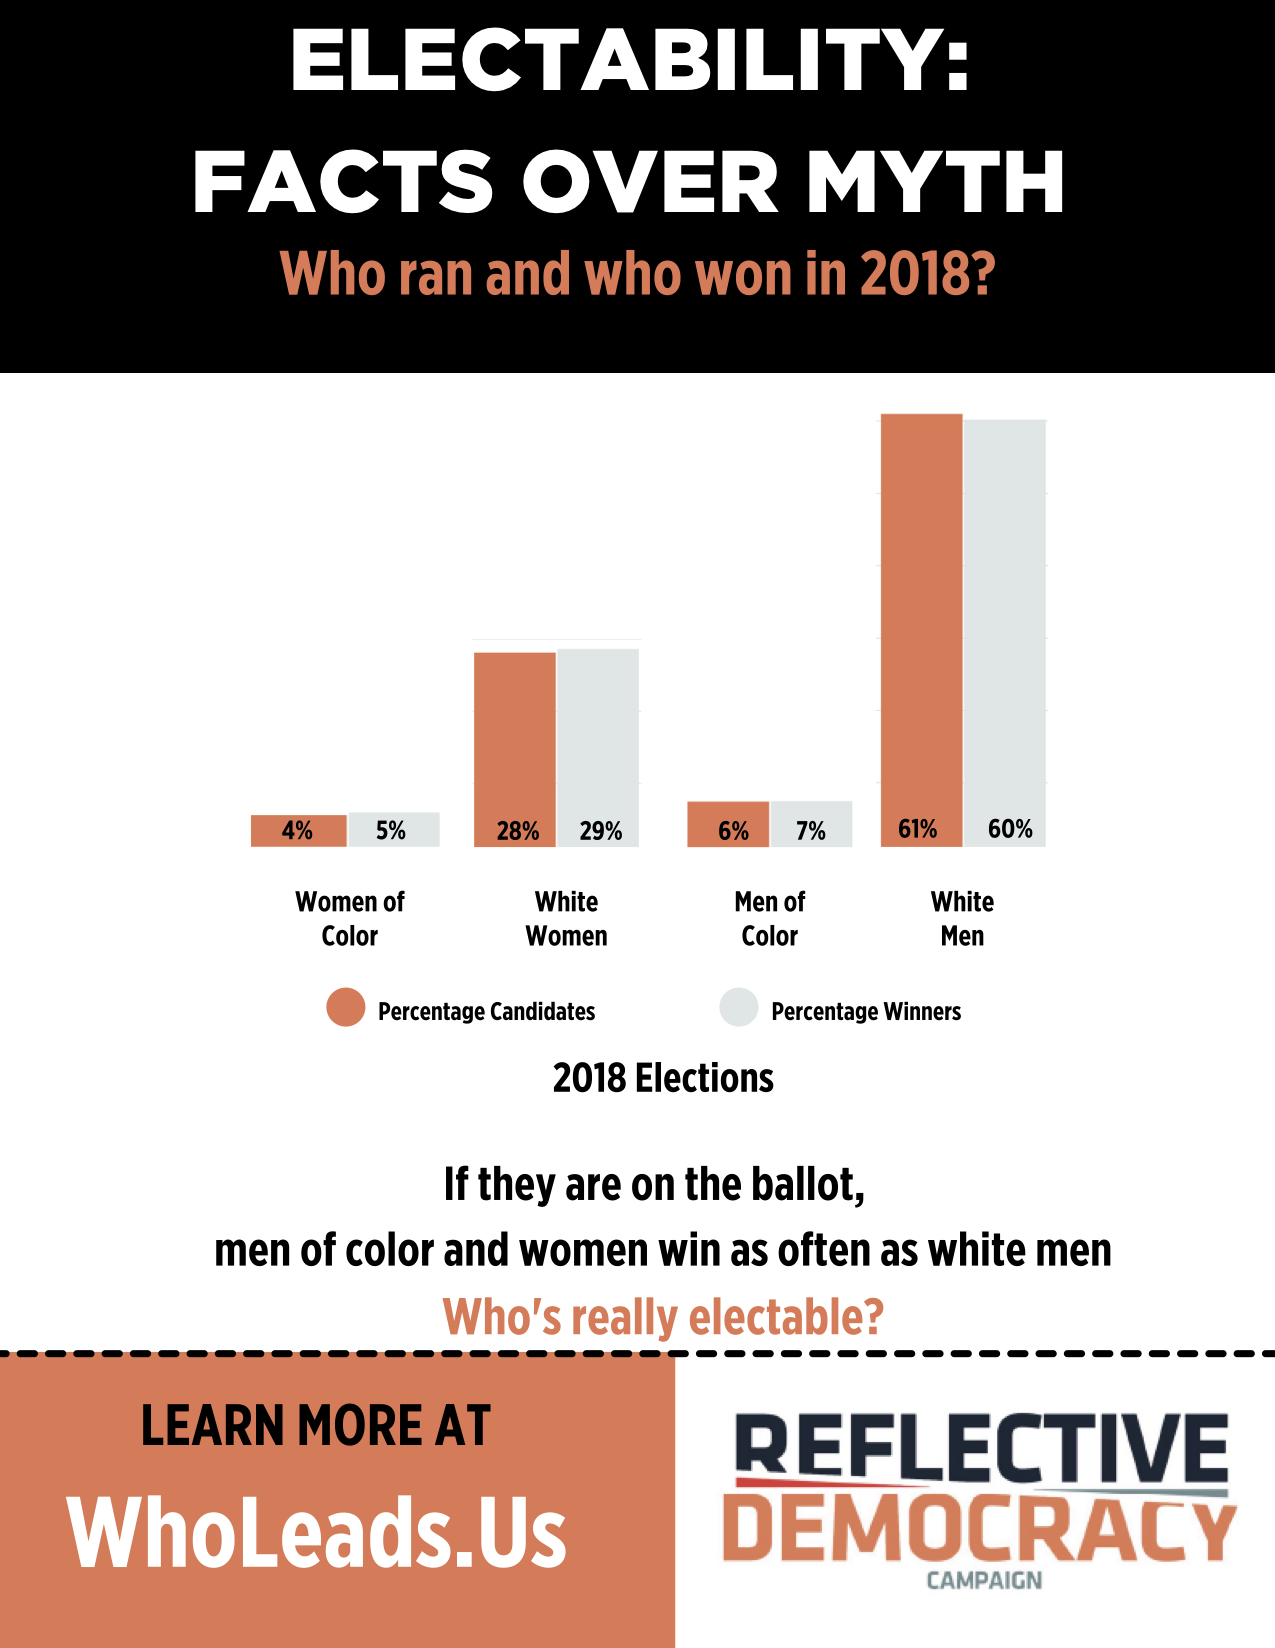
In the 2018 election cycle, women and people of color were just as likely as white men to win their races once they were on the ballot, according to a report by the Reflective Democracy Campaign. And with Democratic women running in record numbers, it was women–and, importantly, diverse women–who flipped the House from red to blue.

“Vote for the Woman Because She’s a Woman.” Time Magazine

The cold hard facts show that women aren’t just electable—they’re empirically more electable than their male counterparts.

“Stop Asking if Women are Electable.” Ms. Magazine
  • View the Report

About the Data

Reviewing voter files and other publicly accessible data, we tracked over 32,200 federal, state, and local candidates on the November 8, 2018 ballot, and nearly 46,000 federal, state, and local elected officials as of 2019.

  • Electability Myth Full Dataset (zip, 20.05 MB)
    Download Dataset
  • 2018 Candidates rev - Summary (xlsx, 162.16 KB)
    Download Dataset
  • 2019 Elected Officials - Summary (zip, 37.33 KB)
    Download Dataset

Read more on...

Demographic Power Shifts Elections & Outcomes

Share our Findings

Graphic
Chart showing people of color and women are shifting the candidate playing field
Comparing Rates of Change Among Candidates

Comparing Rates of Change Among Candidates

Chart showing people of color and women are shifting the candidate playing field

Right click and save the image or click here to download it.

Graphic
Map showing where Women increased representation in State Legislatures. Only Tennessee, West Virginia, and Vermont had no increases.
State Legislatures Gain Women Coast to Coast

State Legislatures Gain Women Coast to Coast

Map showing where Women increased representation in State Legislatures. Only Tennessee, West Virginia, and Vermont had no increases.

Right click and save the image or click here to download it.

Graphic
Bar chart showing candidates percentage vs winner percentage
Electability Infographic Portrait

Electability Infographic Portrait

Bar chart showing candidates percentage vs winner percentage

Right click and save the image or click here to download it.

Graphic
Map showing cities where women mayors replace ment
Mapping Women Mayors Who Replaced Men

Mapping Women Mayors Who Replaced Men

Map showing cities where women mayors replace ment

Right click and save the image or click here to download it.

Graphic
Pie charts comparing US Census data to US elected officials
Who Holds Power in America

Who Holds Power in America

Pie charts comparing US Census data to US elected officials

Right click and save the image or click here to download it.

Graphic
Chart showing Women of Color increased representation at all levels of government
Led By Women, People of Color Add Seats (2015-2019)

Led By Women, People of Color Add Seats (2015-2019)

Chart showing Women of Color increased representation at all levels of government

Right click and save the image or click here to download it.

Footer

Reflective Democracy Campaign

Find us on

  • Twitter
  • Facebook
  • RSS Feed

Research

  • Data Analysis
  • Datasets

Organizing

  • Grantmaking
  • Structural Change

Women Donors Network logo

The Reflective Democracy Campaign is a Project of the Women Donors Network.

Site by Rocketkoi