• Skip to primary navigation
  • Skip to main content
  • Skip to footer

Reflective Democracy Campaign

Investigates and disrupts the demographics of power in the United States

MenuMenu
  • About Us
  • Our Work
        • Overview
        • Organizing
        • Research
        • Datasets
        • Our Work in Focus
        • The Criminal Justice System Exposed
        • The Rise of Women of Color
        • A New Path for Political Gatekeepers
        • Democracy Facts
        • The US, made up of orange, white, and light blue dots. Some dots are larger than others.

          Facts speak louder than memes and misinformation. Explore our Democracy Facts.

  • News & Insights
  • Contact Us
Democracy Facts:

Who Leads Us?

An orange column chart overlaying an illustration of the US. The US is made up of orange, white, and light blue dots. Some dots are larger than others.
  • All Facts
  • Who Leads Us?
  • System Failure
  • Minority Rule
  • Justice for All?
  • Democracy, Emerging

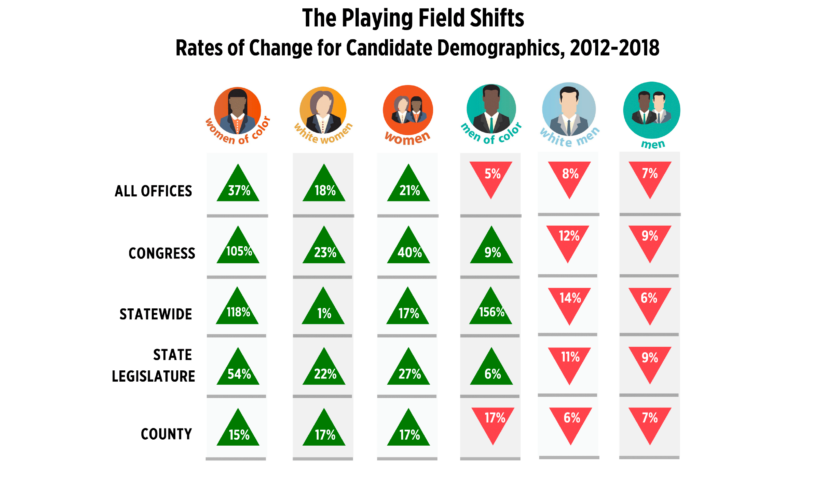
The demographics of power have changed – maybe more than you think. Our research exposes the continuing overrepresentation of white men in office, and the shifting demographic trends offering hope for lasting change.

Who Leads Us?

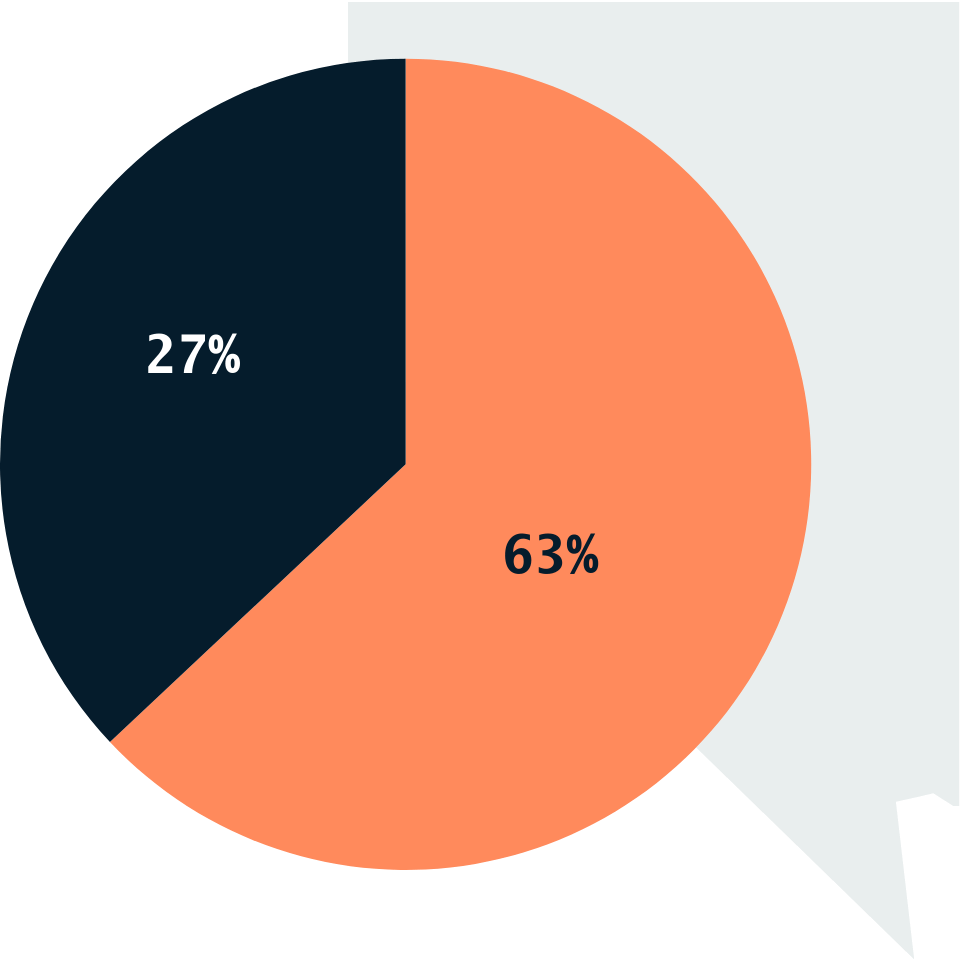
The Nevada state legislature is 63% women.

A pie chart with a wedge that is orange and 63% and a wedge that is dark blue and 27%. The shape of Nevada is in the background.
Download and Share This Fact
Who Leads Us?

The US population is 40% people of color, yet in 15 state legislatures, white people hold 90% or more of seats.

Download and Share This Fact
Who Leads Us?

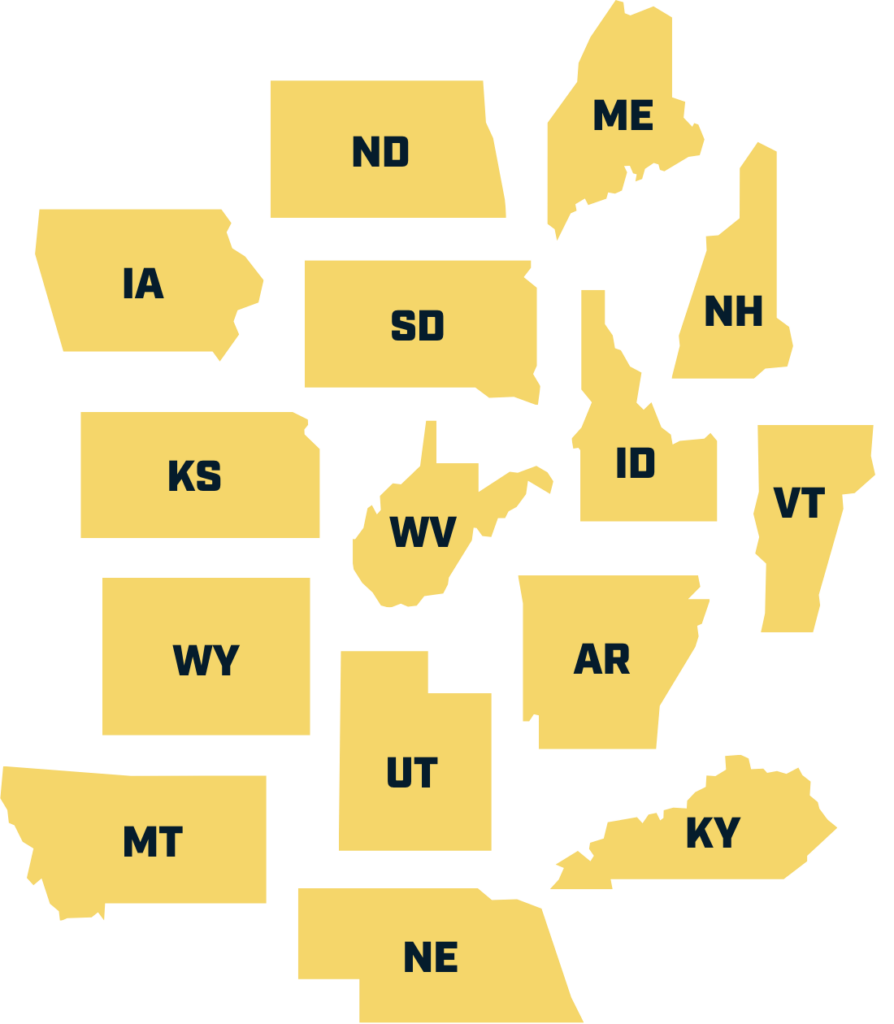
In 15 state legislatures, women hold 40% or more of seats.

Map with Oregon, Washington, California, Nevada, Arizona, New Mexico, Colorado, Florida, Illinois, Michigan, Maryland, Rhode Island, Vermont, New Hampshire, and Maine highlighted.
Download and Share This Fact
Who Leads Us?

In North Dakota, people of color are over 15% of the population but 2% of state legislators.

A grid of 100 stars. 98 are white and the last two are orange. The background is the state of North Dakota.
Download and Share This Fact
Who Leads Us?

In eighteen state legislatures, men hold over 70% of seats. In six of these states, they are 80% or more of state legislators.

Icons of Arkansas, North Dakota, Tennessee, Utah, West Virginia and Wyoming.
Download and Share This Fact
Who Leads Us?

In West Virginia, 87% of state legislators are men.

West Virginia
Download and Share This Fact

Find Out More

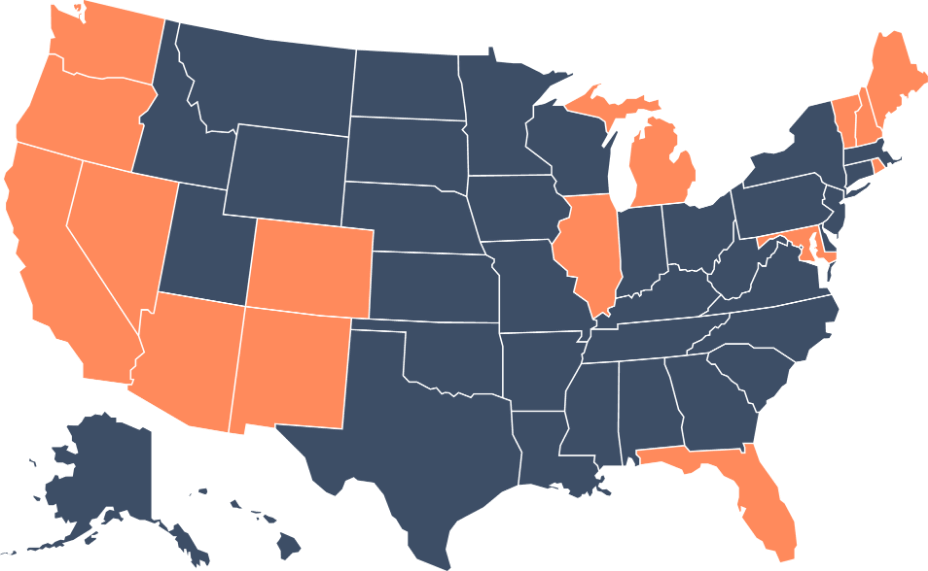
From changes in city leadership to shifts in state legislatures across the map, the emergence of reflective democracy is undeniable.

New York Times: Persistent Disparities Between Leaders and the Led

Alan Rappeport highlights our 2014 data report and public opinion research, showing that white men are extremely over-represented in politics, and that voters do not approve of white male minority rule.

Chart showing women candidates have increased across all levels of government
The Electability Myth: The Shifting Demographics of Political Power in America
Text that says #advanceAAPIpower
#advanceAAPIpower: Asian American Pacific Islander (AAPI) Political Leadership

Footer

Reflective Democracy Campaign

Find us on

  • Twitter
  • Facebook
  • RSS Feed

Research

  • Data Analysis
  • Datasets

Organizing

  • Grantmaking
  • Structural Change

Women Donors Network logo

The Reflective Democracy Campaign is a Project of the Women Donors Network.

Site by Rocketkoi